
20-Second Physics Challenge
Trigger Recognition & Trap Elimination
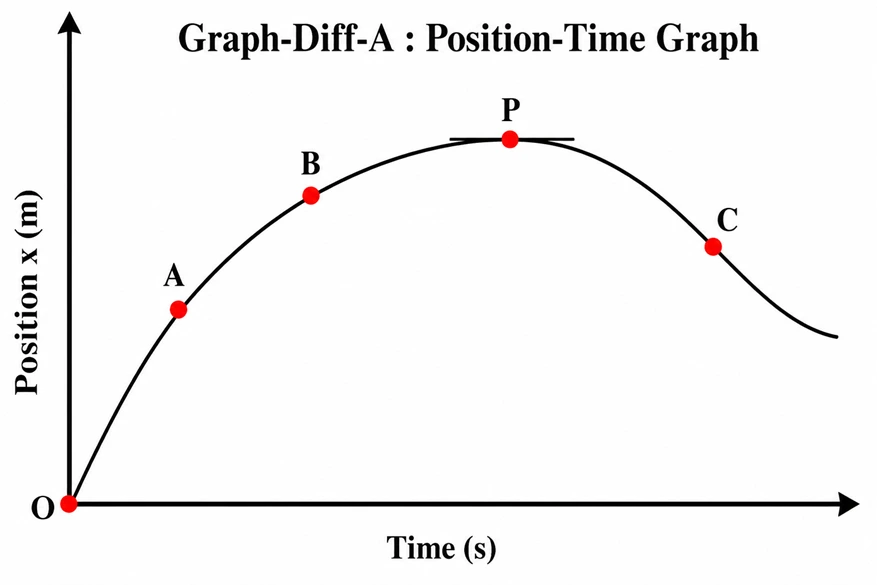
Answer GD-01 to GD-05 using this graph.
Refer Graph-Diff-A. At which point is the velocity zero?
Trigger
Zero slope on position–time graph
Formula
Execution
Refer Graph-Diff-A. At which point is the velocity negative?
Trigger
Negative slope
Formula
Execution
Refer Graph-Diff-A. Which points have positive velocity?
Trigger
Positive slope
Formula
Execution
Refer Graph-Diff-A. At which point is the velocity greatest?
Trigger
Compare graph slopes
Formula
Execution
Refer Graph-Diff-A. Which point represents motion in the negative direction?
Trigger
Direction from velocity sign
Formula
Execution
Refer Graph-Diff-A. At which point is the particle momentarily at rest?
Trigger
Momentarily at rest
Formula
Execution
Refer Graph-Diff-A. As the particle moves from A to B, the particle is
Trigger
Change in graph slope
Formula
Execution
Refer Graph-Diff-A. As the particle moves from B to P, its velocity
Trigger
Slope evolution
Formula
Execution
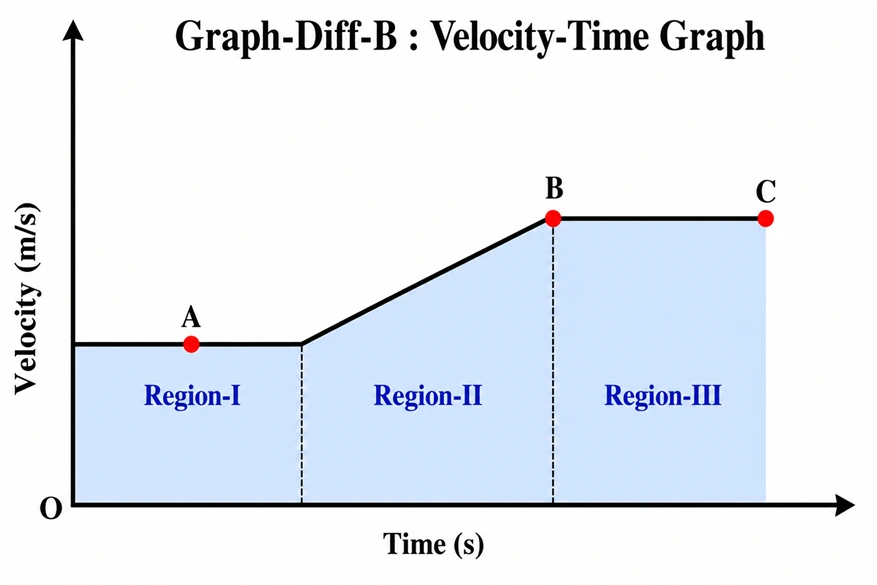
Refer Graph-Diff-B. At point A, the acceleration is
Trigger
Slope of velocity–time graph
Formula
Execution
Refer Graph-Diff-B. At point B, the acceleration is
Trigger
Positive graph slope
Formula
Execution
Refer Graph-Diff-B. At point C, the acceleration is
Trigger
Horizontal v–t graph
Formula
Execution
Refer Graph-Diff-B. In which region is the acceleration positive?
Trigger
Positive slope region
Formula
Execution
Refer Graph-Diff-B. Which region represents motion with constant velocity?
Trigger
Horizontal v–t graph
Formula
Execution
Refer Graph-Diff-B. Which region contributes the greatest displacement?
Trigger
Largest area under v–t graph
Formula
Execution
Refer Graph-Diff-B. The displacement during Region-I is represented by
Trigger
Area interpretation
Formula
Execution
Refer Graph-Diff-B. Compared to Region-I, the displacement during Region-II is
Trigger
Compare graph areas
Formula
Execution
Refer Graph-Diff-B. The total displacement from O to C is
Trigger
Total area concept
Formula
Execution
Refer Graph-Diff-B. The shaded region under the graph represents
Trigger
Area under velocity–time graph
Formula
Execution
Complete the Graph Intelligence journey and move to instability-based thinking.