
2 min read
Imagine watching a moving car.
At this moment, you know only its current speed.
Can you confidently predict exactly when it will stop?
Usually, the answer is no.
Now imagine that instead of looking at the car, you look at its velocity-time graph.
Suddenly, the future seems to become visible.
How can a graph reveal what has not yet happened?
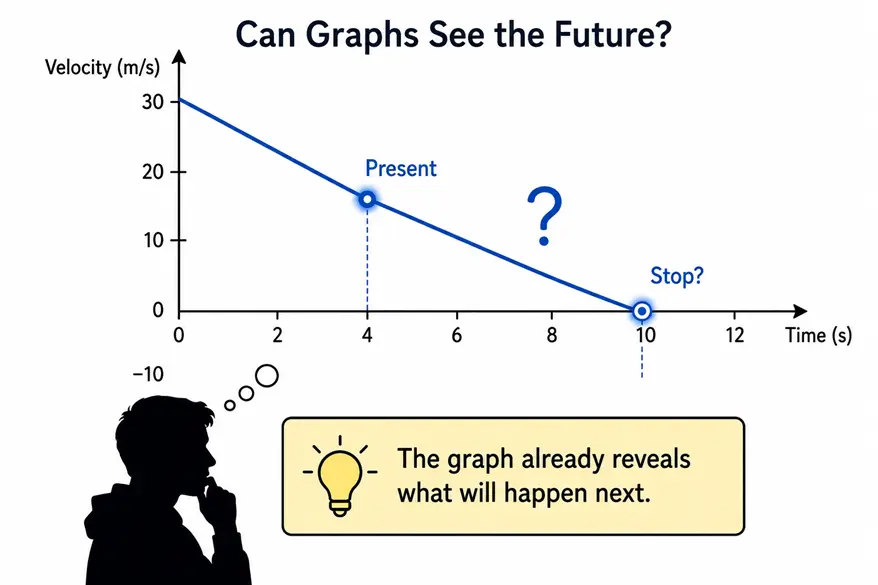
A graph does much more than record measurements.
It reveals the pattern hidden inside the motion.
Once the pattern becomes visible, future behaviour can often be predicted before it actually occurs.
Consider a car whose velocity decreases steadily with time.
At present, the car is still moving.
Yet its velocity-time graph already shows a straight line heading toward the time axis.
Even before the car stops, the graph suggests that the velocity will eventually become zero.
The stopping event has not happened yet.
But the graph already hints that it is coming.
A graph does not merely store information.
It displays how physical quantities are changing.
In kinematics, the shape of a graph contains information about trends.
A rising graph suggests growth.
A falling graph suggests decrease.
A graph approaching zero suggests that the quantity may eventually vanish.
The future behaviour is hidden inside the pattern.
Suppose the velocity of a car changes according to:
The velocity-time graph is a straight line with negative slope.
Setting velocity equal to zero:
Even while the car is still moving, the graph already indicates that it will stop after 10 seconds.
Physics predicts the future because nature follows patterns.
Graphs make those patterns visible.
The graph is not magical.
It does not literally know the future.
It simply reveals the trend that motion is following.